
Everyone wants good returns from mutual funds. Some people want their fund to outperform their colleague’s fund, and others want it to beat the market benchmark, such as the Nifty 50 or Sensex. That’s where comparisons begin, and this is one big reason passive investing has become popular. After all, if all you care about is beating the benchmark, why not just invest in it directly?
But there’s a catch.
While passive index funds charge very low fees, they sometimes fail to match their benchmarks exactly. This is due to what’s called a tracking error—a small mismatch caused by fund expenses and operational issues. So, even, they aren’t “perfectly” passive.
On the other hand, active funds have fund managers, research teams, and strategies to pick better-performing stocks. They aim to beat the benchmark, not just follow it. But this professional management comes at a cost—higher fees. So naturally, investors expect more in return. The big question then becomes: Read more: Index funds in India – How attractive is Passive Investing?
Is your fund truly outperforming the benchmark, consistently and meaningfully?
That’s where the Information Ratio can help.
Related links
Let’s Understand This With a Simple Example
Imagine two friends—Ravi and Sameer—who both invested in two different actively managed mutual funds. Over the last 3 years, Ravi’s fund delivered 12% average annual returns, and Sameer’s fund gave 13%. Both had the Nifty 50 as their benchmark, which returned 11% during the same period.
At first glance, Sameer’s fund looks better. But here’s the twist: Sameer’s fund was very volatile—it had some years of very high returns and some with poor performance. Ravi’s fund, however, gave 12% consistently, year after year.
So, who had the better fund?
This is where the Information Ratio (IR) becomes useful. It doesn’t just look at how much better a fund did compared to its benchmark. It also considers how consistently it delivered that outperformance.
Information Ratio Formula
Information Ratio = Portfolio return for the period minus Benchmark Return / Standard deviation of Portfolio return and benchmark return (or tracking Error)
In other words Information ratio tells, Extra returns over benchmark ÷ Consistency of those extra returns
So, Ravi’s fund, despite a slightly lower return, may have a higher Information Ratio, because it beat the benchmark more reliably. That’s a sign of good fund management.
How to Use Information Ratio in Real Life?
Information Ratio is a great tool when:
- You are comparing two or more funds in the same category, like two large-cap funds.
- You want to know if the extra returns justify the extra fees in active funds.
- You care about consistency, not just flashy one-time performances.
A higher IR (say above 0.5) usually means the fund manager is doing a good job. A negative IR may mean the fund is underperforming the benchmark, not a good sign for an actively managed fund. Read more: Why Beating the Benchmark Isn’t Always the Best Investment Strategy
But like any tool, Information Ratio works best when used with others. Don’t rely on it alone.
Other Ratios to Know (Without the Headache)
Here are some other simple-to-understand ratios that help in fund analysis:
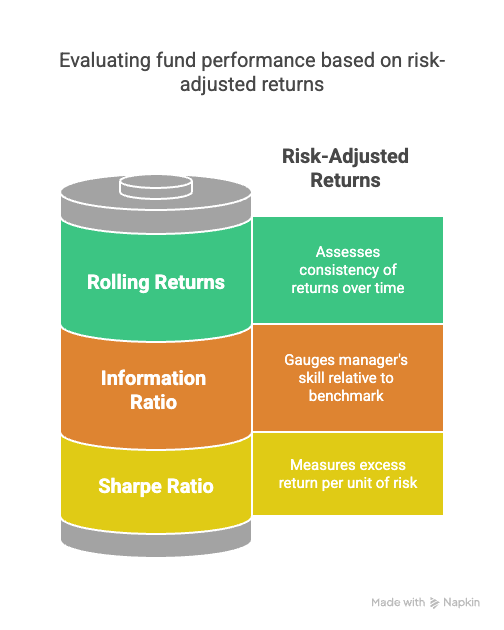
- Sharpe Ratio – Tells you how much return you’re getting for the total risk you’re taking. Higher is better. It looks at the internal volatility of the scheme and the extra return it has generated as compared to the risk-free return. Think of it as: “Am I being rewarded enough for taking this much risk?”
- Standard Deviation – This is the volatility of the scheme’s return vs its average return. Shows how bumpy the ride is. A fund with a high standard deviation will have more ups and downs.
- Rolling Returns – Instead of looking at 1-year, 3-year, or 5-year returns at one fixed date (Point to Point), rolling returns show the performance over many periods. This tells you how stable the fund’s performance really is. Rolling returns have always been a good way to look at the consistency of the returns. Read more: Rolling Returns- A better tool to evaluate Mutual funds
- Alpha – This is simply how much extra return the fund gave after accounting for market movement. If the fund gave 13%, the market gave 11%, and the manager’s strategy created that gap, Alpha is 2%.
- Beta – It tells how sensitive the fund is to market movements. A beta of 1 means it moves exactly like the market; above 1 means more volatile.
Don’t worry about memorizing these. Think of them as different lenses to see the same picture, each showing a different detail.
These are different numbers that may give you some understanding of how the mutual fund has performed in the specific period you are looking to invest. But remember, numbers may also deceive. You change the period, the numbers will change, so you have to look at it from different periods in the past. Say 5 years and 10 years, don’t stick to one period only. Sa,y for example, today if you look at past 5 years which has been good for equity markets and also small caps, you may see different funds coming in your research where as if you look at past 10 years, when the schemes have passed through different market cycles, the numbers may get changed.
So, What Should You Look At While Comparing Mutual Funds?
If you are someone who likes doing comparisons before investing (and you should!), here’s a simple checklist:
- Compare only similar types of funds—large-cap with large-cap, etc.
- Look at the Information Ratio and the Sharpe Ratio for performance vs risk.
- See Rolling Returns over 3 or 5 years to check for consistency.
- Don’t chase the highest past returns—check how reliably they were achieved.
- And always remember—no single ratio tells the full story.
Also Read: 5 Ways to Compare Mutual Funds
Final Words – Information ratio in Mutual fund
It’s easy to get carried away with numbers and returns. But investing is more about staying invested than chasing the “best” fund each year.
If you understand what you’re buying and have clarity about what each ratio tells you, you’ll be better equipped to pick the fund that works for you, not just the one with the highest past return.
So, the next time someone says, “My fund gave 2% more than yours,” you can smile and ask, “Yes, but what’s the Information Ratio?”


