Even when mutual funds carry a disclaimer that ‘past performance does not indicate the future performance of a fund’, for everyone this is the major criterion for selection. Past returns should not be the only parameter for selecting a fund. You should also take into account aspects such as the fund manager’s experience and strategy, the pedigree of the fund house, the level of risk that the fund carries, and the risk-adjusted returns it has offered over various time horizons. As for performance, a fund’s returns can be viewed in different ways. Most common is looking at trailing returns but this method has its limitations. A superior approach is to check rolling returns.
Limitations of CAGR-based returns
When looking up mutual fund returns, one needs to be cautious as the way numbers are presented can be deceiving. Normally, what you see is trailing return, which is shown in terms of compounded annual growth rate (CAGR). This is the manner in which the regulator has also mandated that mutual fund returns be presented. One shortcoming of CAGR return is that it is for a specific time period only, and hence sometimes doesn’t present a holistic picture of a fund’s performance.
CAGR measures investment return over a certain period of time, assuming that the investment has compounded over this period. It is based on the beginning value of the NAV and the end value of the NAV for the period, and presumes that NAV has grown at a constant rate in the interim.
Consider the example of a fund that was started in January 1, 2010, with an NAV of Rs 10. By December 31, 2015, its NAV had increased to Rs 20. The CAGR return of the fund over the five-year period comes to 14.86 per cent, which seems pretty good. The problem with this measure of return is that it doesn’t tell you how the fund behaved in different market conditions.
CAGR returns carry what is known as recency bias. If over the last year the market has been experiencing a bull run and equity prices have moved up, that will make the fund’s three-year and five-year CAGR returns look good. The reverse happens when the markets are down.
The reality is that all market-linked instruments experience volatility. How well the fund manager has dealt with those volatile times indicates its consistency. A fund manager’s performance should be evaluated not just in terms of the returns he has produced, but also in terms of how well he has managed to contain volatility.
CAGR returns can also be manipulated to present a picture that is rosier than the reality. The presenter can do so by choosing the initial and final dates for calculating CAGR returns. In the example given above, the fund may have not delivered any return at all in the first four years. All the returns may have come in the previous one year. By adding the previous one year’s performance, he can show that the five-year CAGR return has been 14.86 per cent and the three-year return has been 26 per cent.
The superior method
To overcome the shortcomings of CAGR returns, one needs to look at rolling returns over different time periods. This will show how the fund has performed over different three-year periods.
Rolling returns are basically annualised returns or CAGR returns over different time periods.
Suppose that you wish to invest on January 1, 2016, and want to look up how the fund has performed over different three-year periods. You could check the fund’s three-year returns starting December 31, 2012, December 30, 2012, December 29, 2012, and so on. The average of these figures will give you a better sense of performance.
You may carry out this exercise for weekly, monthly, quarterly or even yearly rolling cycles. All this data needs to be compared with the rolling returns of the fund’s benchmark and also with that of funds within the peer group.
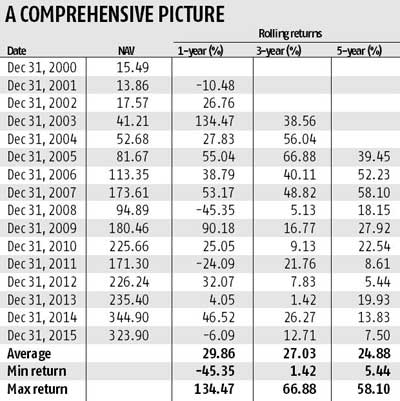
Next, let us understand how rolling return works with real data belonging to a popular fund. We have taken the rolling returns over one-, three-and five-year periods. By looking at this data one gets a better picture of how consistent the fund has been.

The data in the table clearly shows that though the fund’s average return has been quite good, there have been three-year and even five-year periods when the fund has delivered only single-digit return. So if you think that five years is a long time frame that entitles you to at least a double digit return from an equity fund, think again. Note that there were four periods of negative return over the one-year rolling cycle, but none in the three-year and five-year cycles.
Compare returns
You need to repeat the same exercise with the fund’s benchmark index, or a fund that belongs to the same category. Doing such comparison will offer a better picture of the fund’s consistency. You may also calculate standard deviation which will tell you how volatile the fund has been in different time periods.
While CAGR is no doubt a good measure of return, it is dependent on the time period chosen. Rolling returns remove this shortcoming. Instead of looking at the returns for a single period, you get to view returns over multiple periods and can gauge how the fund manager has performed in different cycles. You can also judge whether the fund has performed only due to market movement, or it was due to fund manager’s call.
This article was written by me for Business Standard. Published on 14th Feb 2016


